Best Tools to Create and Analyze Trello Reports
5 min read
Trello is a popular project management tool that helps teams organize their projects into boards, lists, and cards. While Trello excels at visualizing tasks and workflows, users often seek additional tools to create and analyze reports for deeper insights into their projects' progress, productivity, and overall performance. This article explores some of the best tools and integrations available for creating and analyzing reports in Trello.
1. Trello Power-Ups
Trello’s power-ups extend the functionality of Trello boards, including capabilities for reporting and analytics.
Planyway Reports
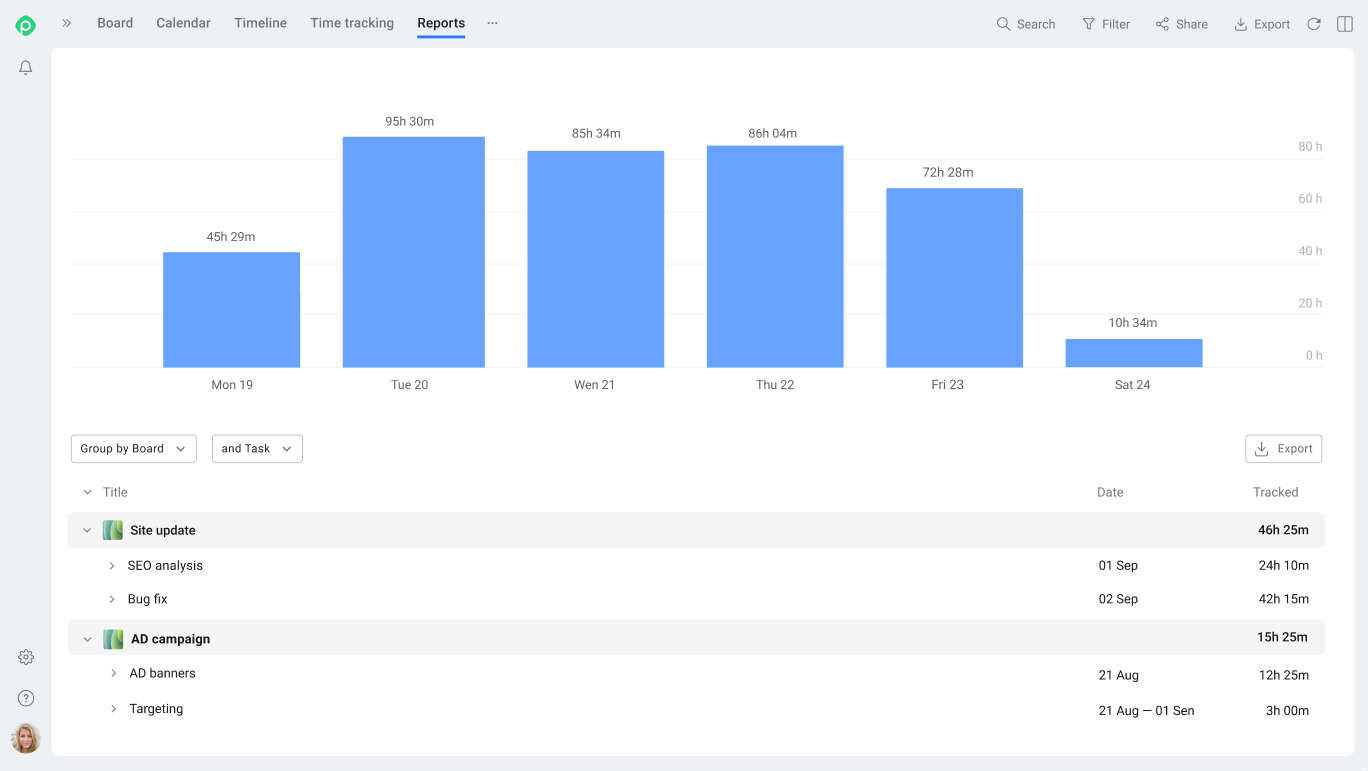
Planyway is a versatile Trello power-up that extends Trello's functionality into the realm of time management, calendar scheduling, and project planning. It's particularly known for its intuitive interface that seamlessly integrates with Trello boards, enabling users to plan and track their work more effectively. Beyond its scheduling capabilities, Planyway also offers robust reporting features that can be crucial for project analysis and team productivity tracking.
Time Tracking and Reporting: Planyway allows users to track the time spent on individual tasks directly within Trello cards. This feature is indispensable for teams that need to monitor work hours, billable time, or simply want to increase productivity by analyzing time allocation across tasks and projects.
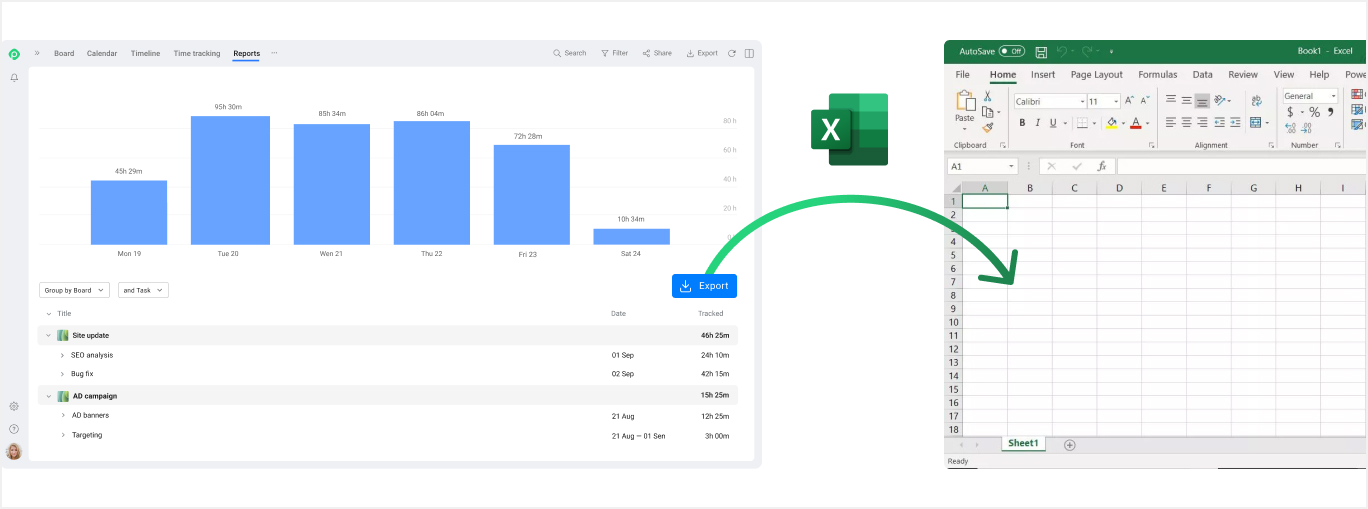
Customizable Excel Reports: With Planyway, users can generate customizable reports in Excel based on not just the time tracked but all other task attributes. These reports can provide insights into project progress, individual contributions, and areas that may require additional attention or resources. The ability to filter reports by team member, task, project, or date range makes Planyway a flexible tool for various reporting needs.
Blue Cat Reports
This power-up enables users to generate detailed reports and charts directly from their Trello boards. Users can see the status of every card on every board from any perspective: board, list, label, etc. Also, there is a wide range of charts available: pie, bar, historical, counts, time to complete.
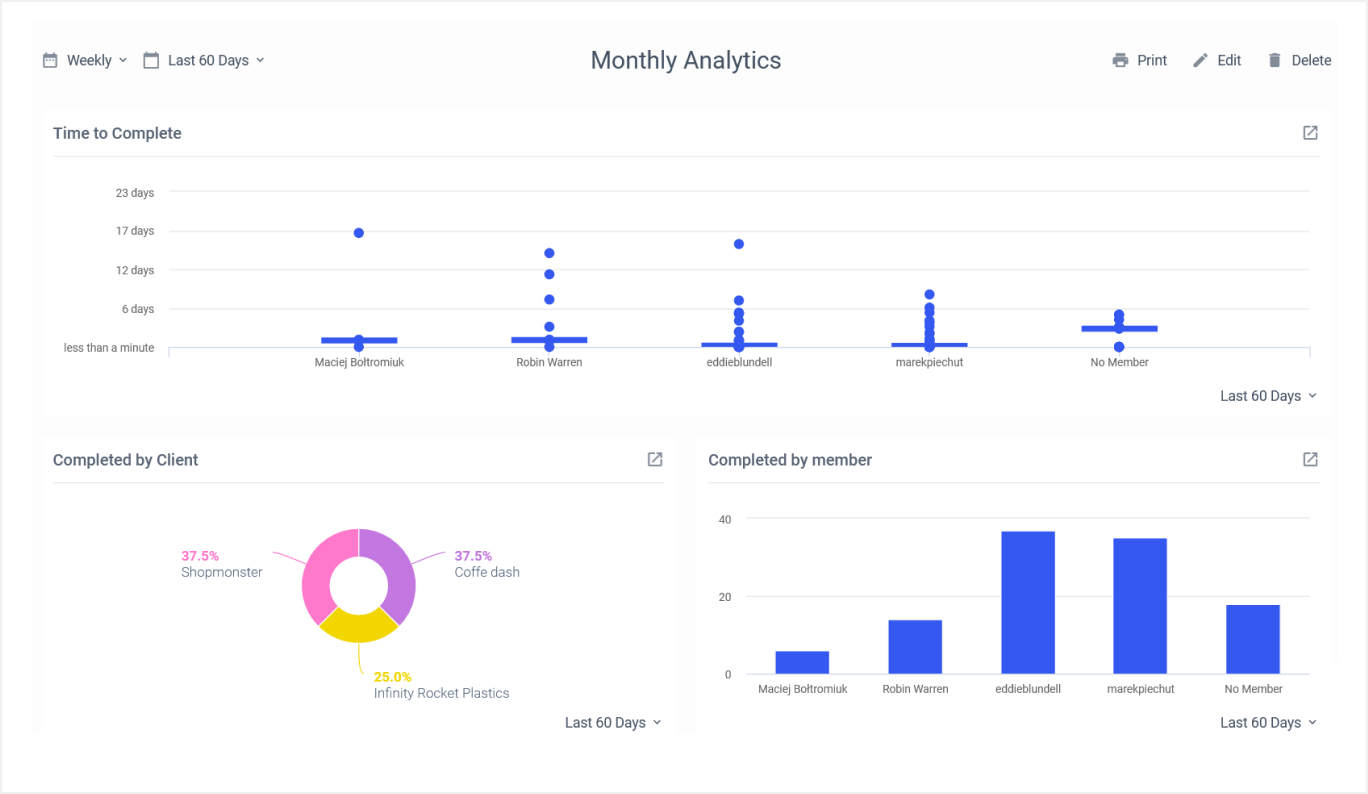
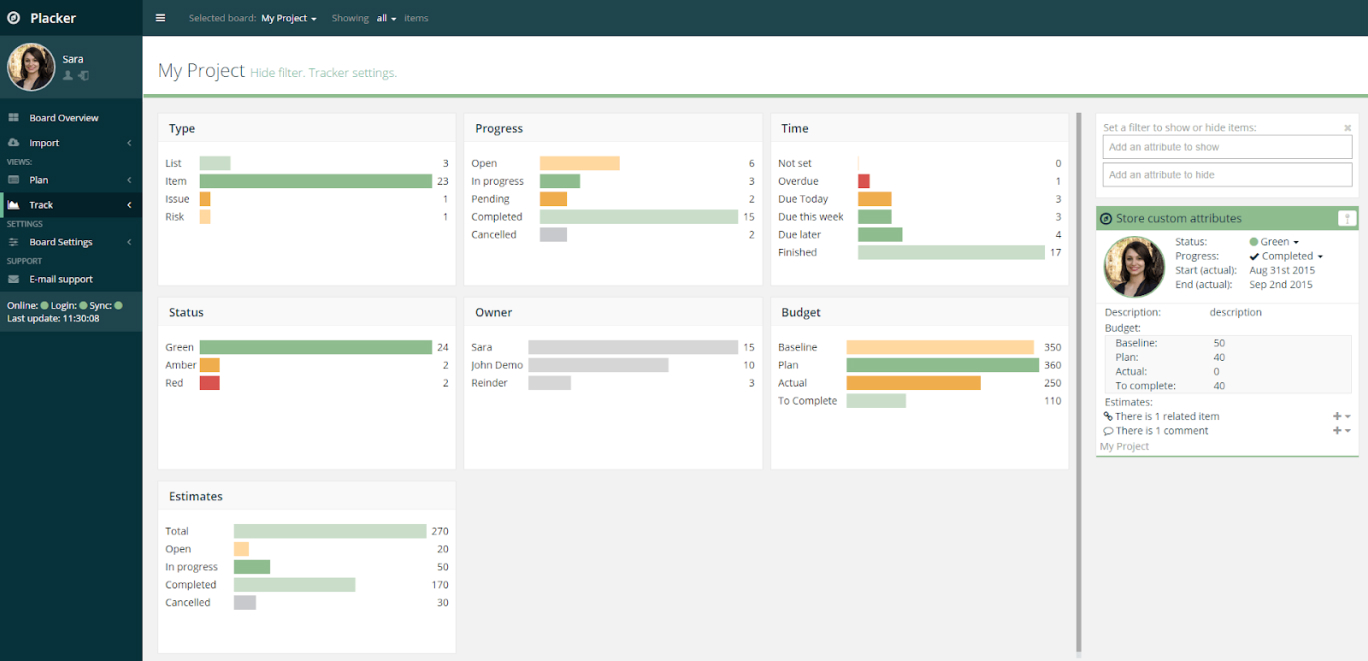
Dashboard (by Placker)
Offers a high-level overview of project progress through dashboards that aggregate data across multiple boards. It's great for tracking key performance indicators (KPIs) and managing resources.
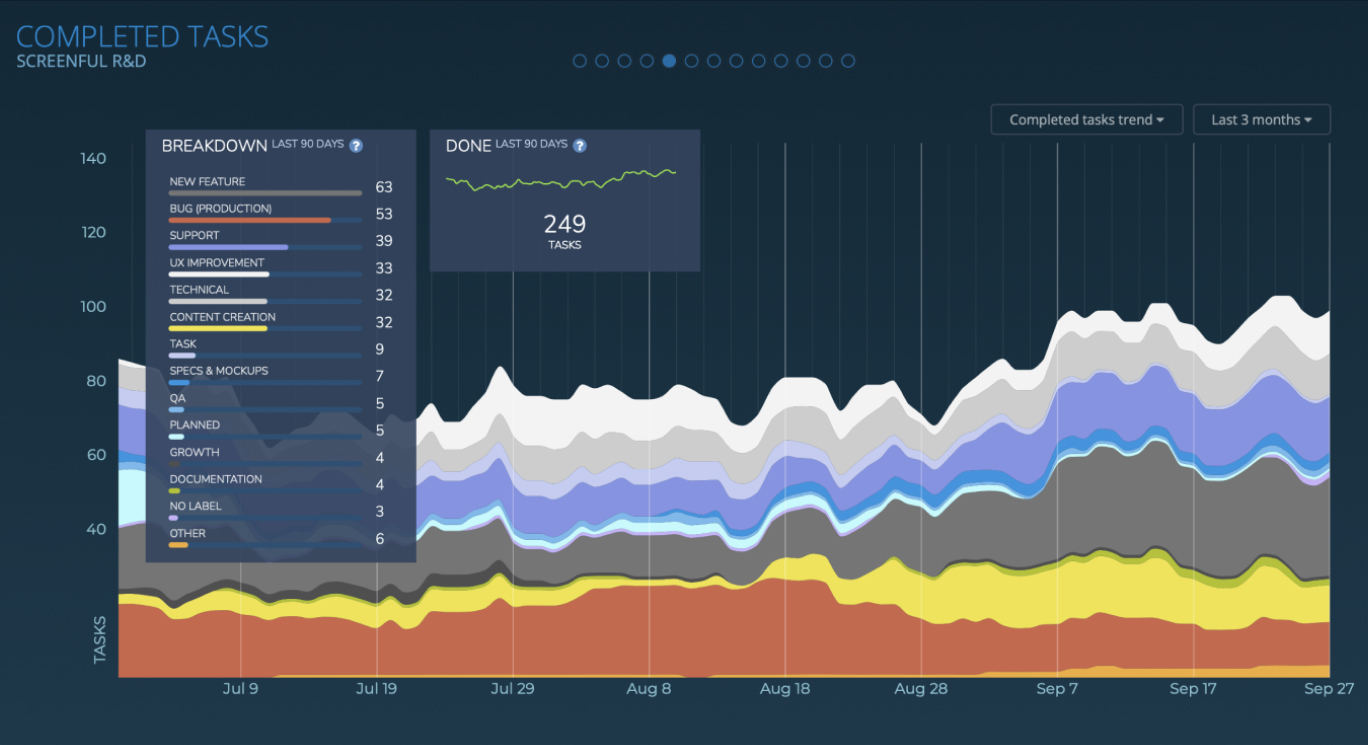
Dashboards (by Screenful)
For those who need to work with sprints and releases, Screenful offers advanced reporting features like lead & cycle times, cumulative flow, and other key metrics that help you to deliver better software.
2. External Reporting Tools
Some teams might require even more robust reporting capabilities. Several external tools integrate with Trello to provide comprehensive analytics and reporting features.
Zapier
While not a reporting tool per se, Zapier can connect Trello with various analytics and reporting tools, automating the flow of information between Trello and other platforms like Google Sheets, where users can create custom reports and dashboards.
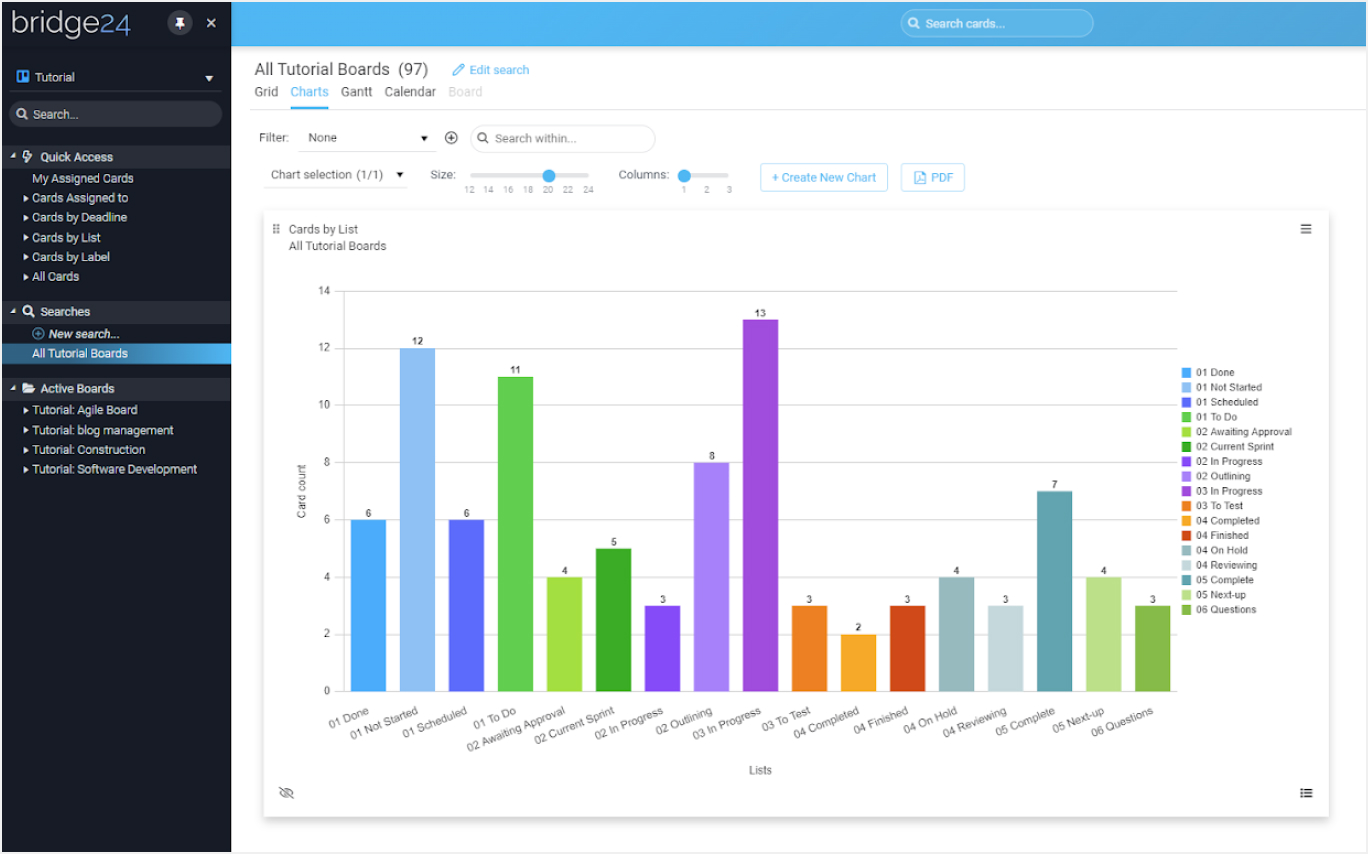
Bridge24 for Trello
Bridge24 enhances Trello’s reporting capabilities by offering advanced filters, charts, and exporting options. It allows users to create custom reports and dashboards that can be exported to Excel or PDF for further analysis.
3. Analytics and BI Tools
For teams that require in-depth analysis and data visualization, integrating Trello with a Business Intelligence (BI) tool can be a powerful solution.
Power BI
By connecting Trello with Power BI, users can pull data into customizable dashboards and reports. This setup is ideal for businesses that require detailed analytics, trend analysis, and predictive modeling.
Tableau
Similar to Power BI, Tableau can connect to Trello to visualize data in comprehensive, interactive reports. Users can analyze their project data in greater depth, identifying patterns and insights that can help guide decision-making.
4. Custom Solutions
For unique reporting needs, developing custom solutions using Trello’s API might be the best approach. Teams with development resources can create bespoke applications or scripts that pull data from Trello and generate custom reports tailored to their specific requirements.
Conclusion
Trello’s flexibility and simplicity make it a favored tool for project management. By leveraging the right mix of power-ups, external tools, and BI platforms, teams can significantly enhance their reporting and analytics capabilities within Trello. Whether you need basic progress tracking or in-depth analytical insights, there is a solution that can be tailored to meet your project's needs. With the right tools, teams can unlock valuable data-driven insights to drive productivity and project success.